The intent of the classification process is to categorize all pixels in a digital image into one of several land cover classes, or "themes". This categorized data may then be used to produce thematic maps of the land cover present in an image. Normally, multispectral data are used to perform the classification and, indeed, the spectral pattern present within the data for each pixel is used as the numerical basis for categorization (Lillesand and Kiefer, 1994). The objective of image classification is to identify and portray, as a unique gray level (or color), the features occurring in an image in terms of the object or type of land cover these features actually represent on the ground.
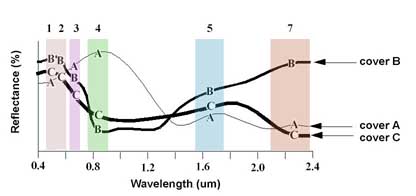
Figure Spectral Reflectance curve of 3 land covers
Image classification is perhaps the most important part of digital image analysis. It is very nice to have a "pretty picture" or an image, showing a magnitude of colors illustrating various features of the underlying terrain, but it is quite useless unless to know what the colors mean. (PCI, 1997). Two main classification methods are Supervised Classification and Unsupervised Classification.
With supervised classification, we identify examples of the Information classes (i.e., land cover type) of interest in the image. These are called "training sites". The image processing software system is then used to develop a statistical characterization of the reflectance for each information class. This stage is often called "signature analysis" and may involve developing a characterization as simple as the mean or the rage of reflectance on each bands, or as complex as detailed analyses of the mean, variances and covariance over all bands. Once a statistical characterization has been achieved for each information class, the image is then classified by examining the reflectance for each pixel and making a decision about which of the signatures it resembles most. (Eastman, 1995)
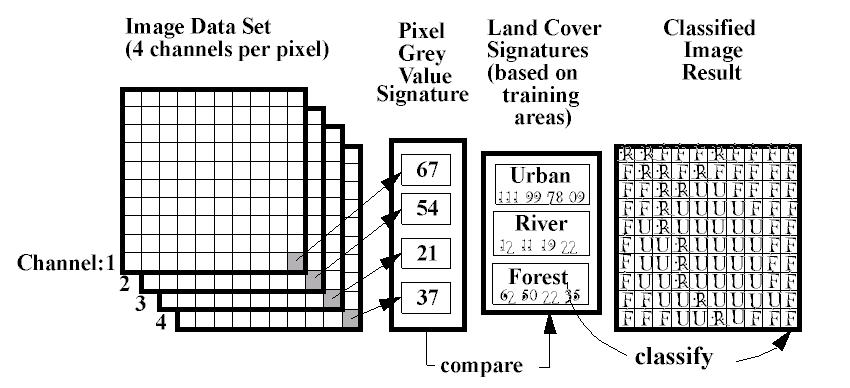
Figure Steps in Supervised classification
Maximum likelihood Classification
Maximum likelihood Classification is a statistical decision criterion to assist in the classification of overlapping signatures; pixels are assigned to the class of highest probability.
The maximum likelihood classifier is considered to give more accurate
results than parallelepiped classification however it is much slower due to extra computations. We put the word `accurate' in quotes because this assumes that classes in the input data have a Gaussian distribution and that signatures were well selected; this is not always a safe assumption.
Minimum distance Classification
Minimum distance classifies image data on a database file using a set of 256 possible class signature segments as specified by signature parameter. Each segment specified in signature, for example, stores signature data pertaining to a particular class. Only the mean vector in each class signature segment is used. Other data, such as standard deviations and covariance matrices, are ignored (though the maximum likelihood classifier uses this).
The result of the classification is a theme map directed to a specified database image channel. A theme map encodes each class with a unique gray level. The gray-level value used to encode a class is specified when the class signature is created. If the theme map is later transferred to the display, then a pseudo-color table should be loaded so that each class is represented by a different color.
The parallelepiped classifier uses the class limits and stored in each class signature to determine if a given pixel falls within the class or not. The class limits specify the dimensions (in standard deviation units) of each side of a parallelepiped surrounding the mean of the class in feature space.
If the pixel falls inside the parallelepiped, it is assigned to the class. However, if the pixel falls within more than one class, it is put in the overlap class (code 255). If the pixel does not fall inside any class, it is assigned to the null class (code 0).
The parallelepiped classifier is typically used when speed is required. The draw back is (in many cases) poor accuracy and a large number of pixels classified as ties (or overlap, class 255).
Unsupervised classification is a method which examines a large number of unknown pixels and divides into a number of classed based on natural groupings present in the image values. unlike supervised classification, unsupervised classification does not require analyst-specified training data. The basic premise is that values within a given cover type should be close together in the measurement space (i.e. have similar gray levels), whereas data in different classes should be comparatively well separated (i.e. have very different gray levels) (PCI, 1997; Lillesand and Kiefer, 1994; Eastman, 1995 )
The classes that result from unsupervised classification are spectral classed which based on natural groupings of the image values, the identity of the spectral class will not be initially known, must compare classified data to some from of reference data (such as larger scale imagery, maps, or site visits) to determine the identity and informational values of the spectral classes. Thus, in the supervised approach, to define useful information categories and then examine their spectral separability; in the unsupervised approach the computer determines spectrally separable class, and then define their information value. (PCI, 1997; Lillesand and Kiefer, 1994)
Unsupervised classification is becoming increasingly popular in agencies involved in long term GIS database maintenance. The reason is that there are now systems that use clustering procedures that are extremely fast and require little in the nature of operational parameters. Thus it is becoming possible to train GIS analysis with only a general familiarity with remote sensing to undertake classifications that meet typical map accuracy standards. With suitable ground truth accuracy assessment procedures, this tool can provide a remarkably rapid means of producing quality land cover data on a continuing basis.