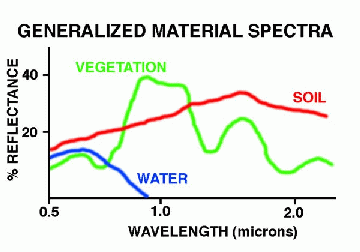
We can further understand this difference in brightness of water, soil and vegetation if we take a look at the figure above. This shows three curves, each called a spectrum, for three different materials. In each spectrum, the percentage of light that is reflected is shown as a function of wavelength. Notice that "vegetation" is very bright about 1.0 microns compared to soil. The relative contrast is reversed at wavelengths greater than 1.5 microns. Water, in comparison, is brightest at short wavelengths, and we see no reflection at a wavelength longer than about 0.9 microns. Using these spectra, we can understand the relative contrast of the water, vegetation and the soil. If we had continued these spectra to thermal wavelengths, we would also have seen that temperature becomes important, with hot objects being brighter than cooler objects.

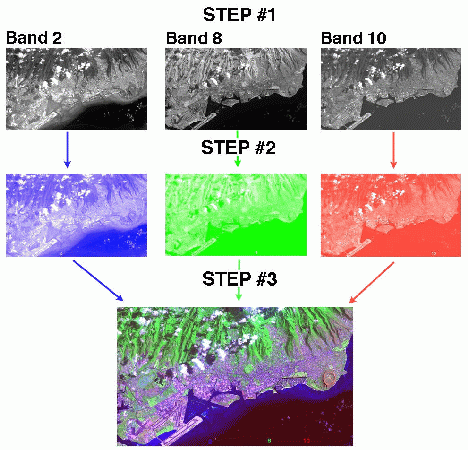
Having seen that different bands (or wavelengths) have a different contrast, we can now study how the computer can produce a color image from a remote sensing data set. To do this, we take three images, which are the black and white images corresponding to Bands 2, 8 and 10. This is STEP #1 in this figure. Remember, this is how the satellite will record the reflective brightness in the different parts of the spectrum that we saw in the first figure.
Just like a color television set, our computer screen can display three different images using blue light, green light and red light. The combination of these three wavelengths of light will generate the color image that our eyes can see. So, if we display now display Band 2 in blue light, Band 8 in green light, and Band 10 in red light (STEP#2) we get the relative contrast between the three images. More importantly, when these three colors are combined (STEP#3), we get our color image, which we call a "false color image", because it has nothing to do with the colors we see with our eyes.
So, to answer the original question "what do the colors mean in the image?", we must know which band (or wavelength) is used for each of the blue, green and red parts of the computer display. Without detailed knowledge of how each band has been changed for contrast and brightness, we cannot be sure why the colors are what they are, but at least we can make some educated guesses.
